In 2025, ECF was a partner in Cycling Counts, a project on cycling data commissioned by the Directorate-General for Mobility and Transport (DG MOVE) at the European Commission. Following up on the commitments of the EU Declaration on Cycling, the aim of “Cycling Counts” was to establish, for the first time, an EU-wide data baseline in the domains of networks (infrastructure), use, safety and services. This data baseline will be instrumental for measuring progress in cycling policy and planning in the EU for years to come.
After the results of the project have been validated and published by the European Commission, we can reveal some key insights here.
Cycle network
In the framework of Cycling Counts, we defined “cycle networks” as the road infrastructure that can under most circumstances be safely used by cyclists. This includes cycle tracks and cycle lanes as the two main infrastructure types of the dedicated cycle network, but also cycle-friendly mixed-traffic roads (e.g. those with a speed limit of 30 km/h) as part of the extended network. Each of these three main infrastructure types can be described through a large range of variations in terminology in national, regional and local classifications.
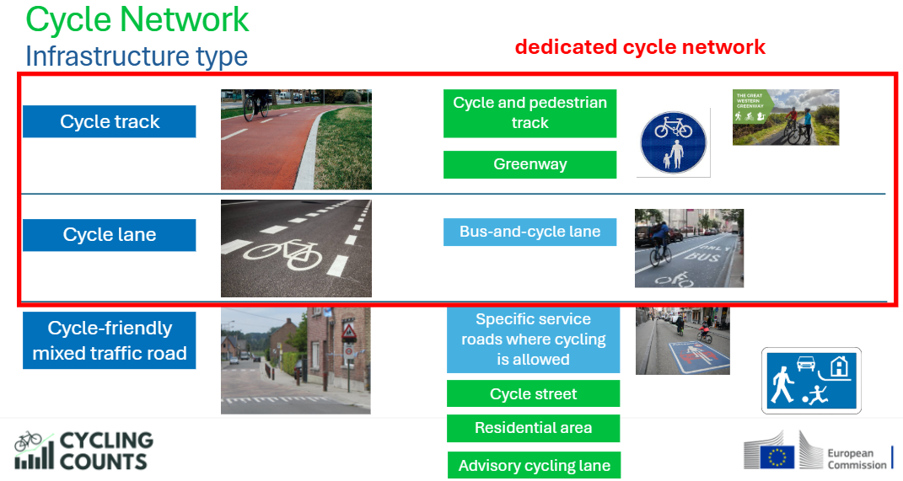
To establish an EU-wide baseline for the network, we carried out an in-depth analysis that combined data on these infrastructure types from Open Street Map (as used previously in ECF’s Cycling Infrastructure Tracker) with official data from 9 national and 23 regional and local datasets. In total, we analysed 116 datasets for potential inclusion in the baseline.
The results of the analysis showed that the extended cycling network in the EU currently comprises a length of almost one million kilometres, which corresponds to a coverage of more than 16% of the road network. However, only around one third of this total, corresponding to a bit less than 6% road network coverage, is dedicated cycling infrastructure. There is an important variation among Member States, with a range between 0.2% and 25.3% for road network coverage with dedicated cycling infrastructure. Within the dedicated network, cycle tracks (physically separated from motorised traffic, ca. 312,000 km) are much more prevalent than cycle lanes (ca. 31,000 km).
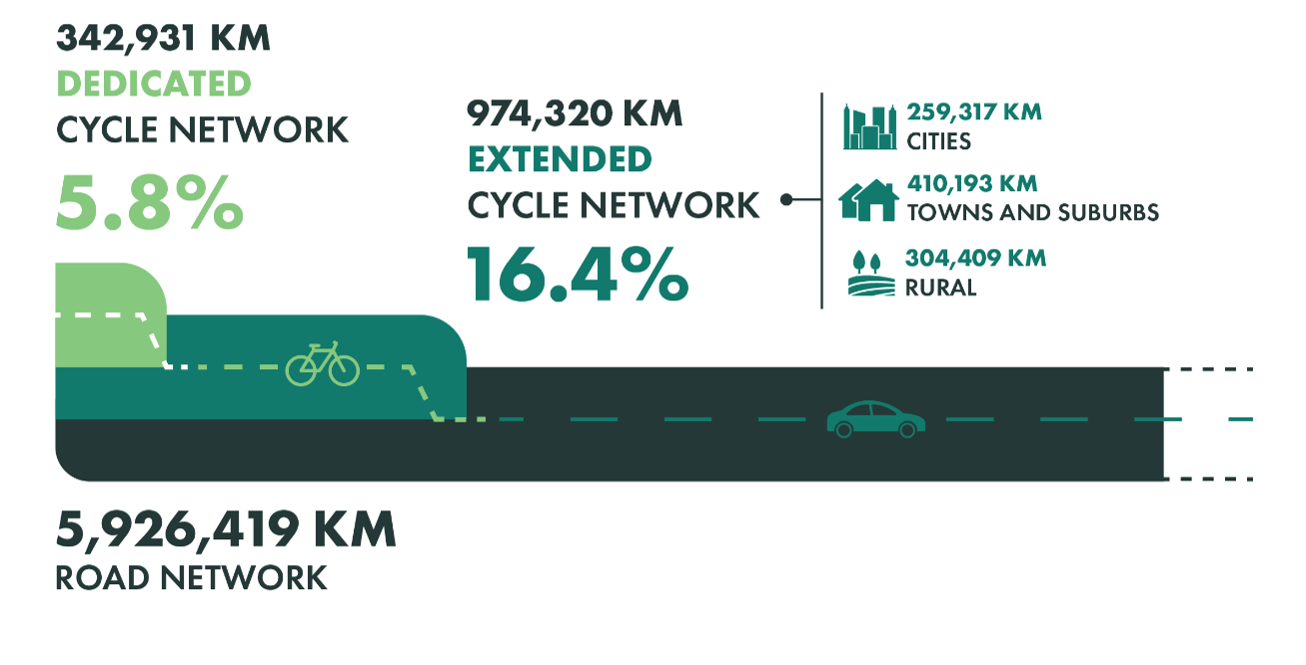
These figures provide a first comparable EU overview of the network accessible to cyclists and are meant to form the baseline for future monitoring. The results highlight strong national differences in data coverage, quality, classification systems, definitions, and completeness. A few Member States have established national cycling infrastructure datasets, while others rely almost entirely on regional or municipal datasets. In many countries, OpenStreetMap remains the only comprehensive source, and was essential for establishing the baseline.
Cycle use
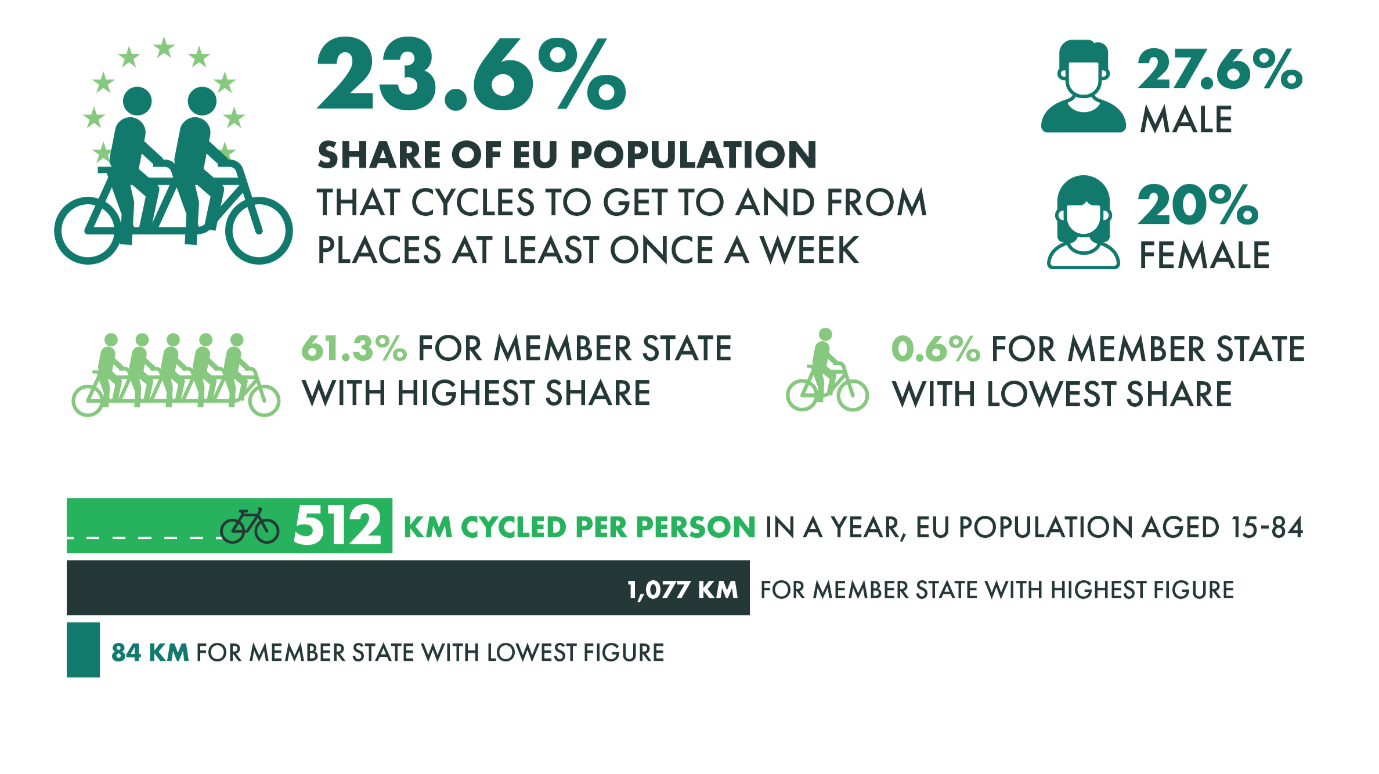
The results of Cycling Counts confirm the place of cycling as a transport mode in its own right for Europeans already today, even though there are large variations among EU Member States. Data from the European Health Interview Survey shows that ca. 24% of the EU population cycles to get to and from places at least once a week, with a range from 1% to 61% between the 27 Member States. According to an EU-wide travel survey carried out in 2021, Europeans cycle 512 km per person per year on average (range: 84 km to 1,077 km). The share of cycling trips in all trips across the EU is 7.8% (range: 0.8% to 28.0%). Modal share is higher among men (9.2%) than women (6.3%).
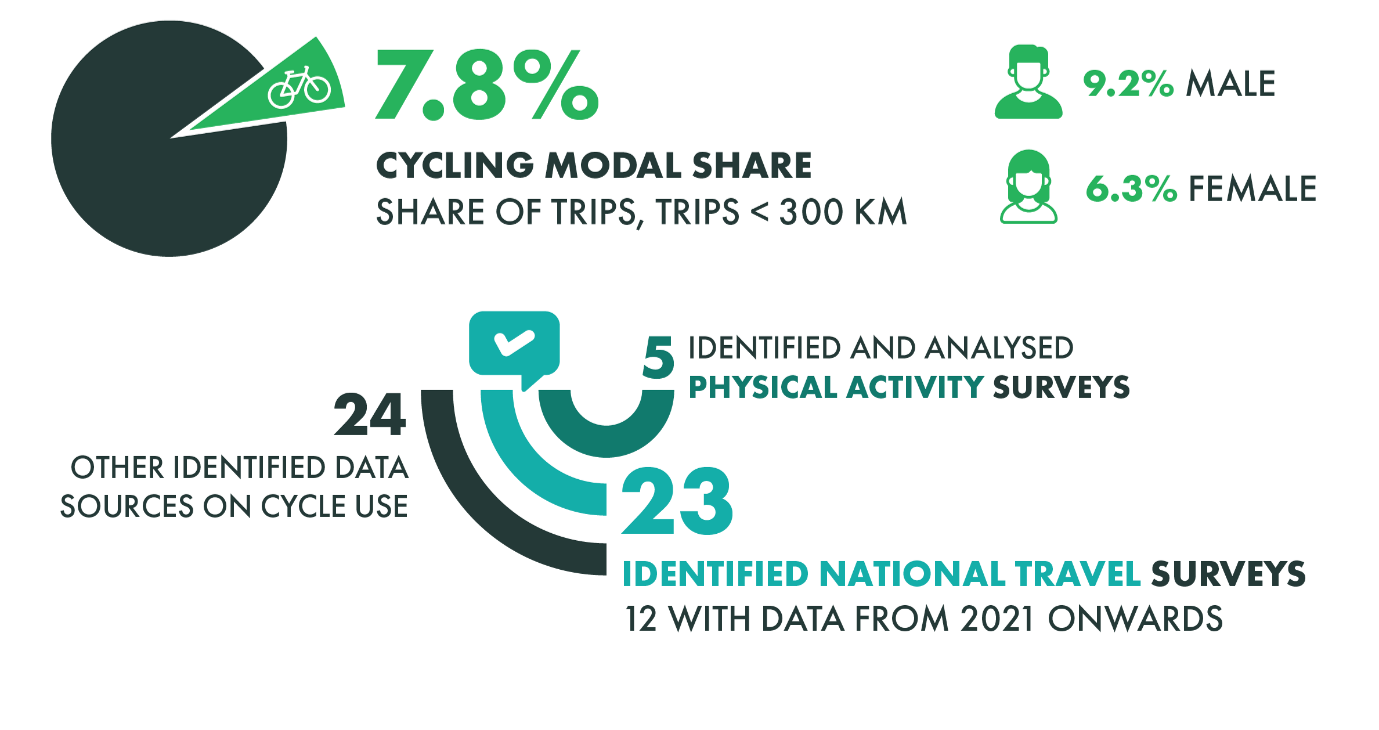
As for the network domain, large variations persist in terms of data availability and collection methodologies. We identified 23 national travel surveys; however, only 12 of those were carried out relatively recently (2021 and onwards), and only 7 contained data for all indicators from our EU-wide analysis. National surveys also differ in surveying methodology, sample sizes, age groups included, definitions of trips and many other points, which makes it impossible to directly compare results in between Member States and with the EU-wide surveys mentioned above.
Cycling safety
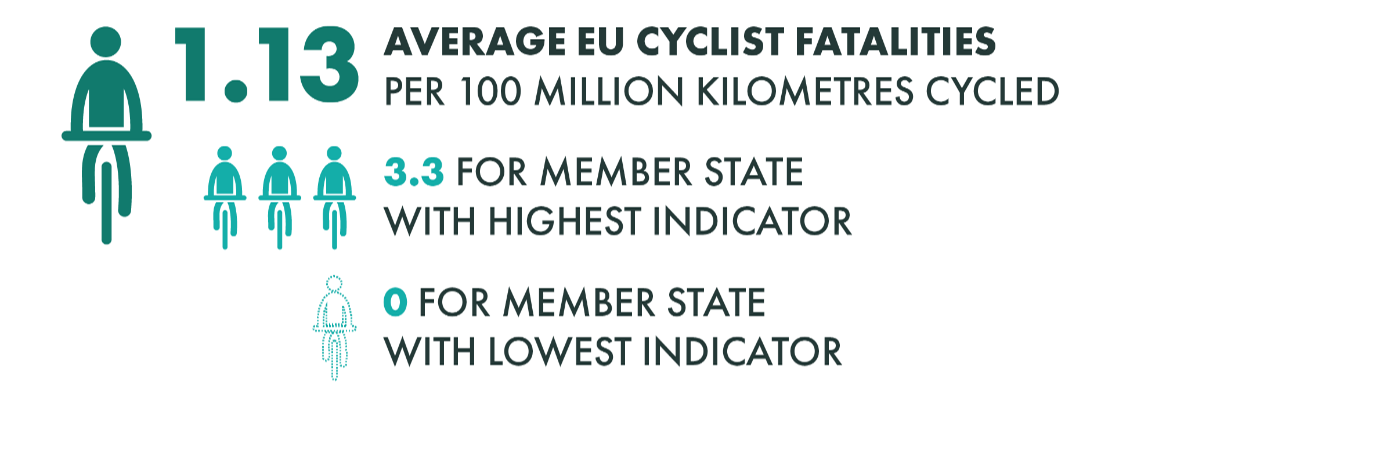
In the domain of road safety for cyclists, the EU-wide CARE database provides harmonised fatality data, which enabled us to calculate an exposure-based fatalities indicator. The EU-wide travel survey mentioned above was used as a base for exposure data (distance cycled). At EU-level, there are 1.13 fatalities per 100 million kilometres cycled, with a range from 0.0 to 3.3 fatalities per 100 million kilometres for Member States. However, the values for Member States need to be interpreted with caution as overall fatality numbers can be close to zero, especially in smaller countries with low cycling activity, meaning that one extra fatality can have a big impact on the indicator.
To mitigate this issue, an important additional indicator in this domain would be the number of (serious) injuries per 100 million kilometres cycled. However, our analysis showed that injury data collection is still too divergent across Member States to provide comparable data for this indicator.
Cycle services
The Cycling Counts analysis in the services domain focused on three sectors: bike sharing, cycle logistics and cycle parking.
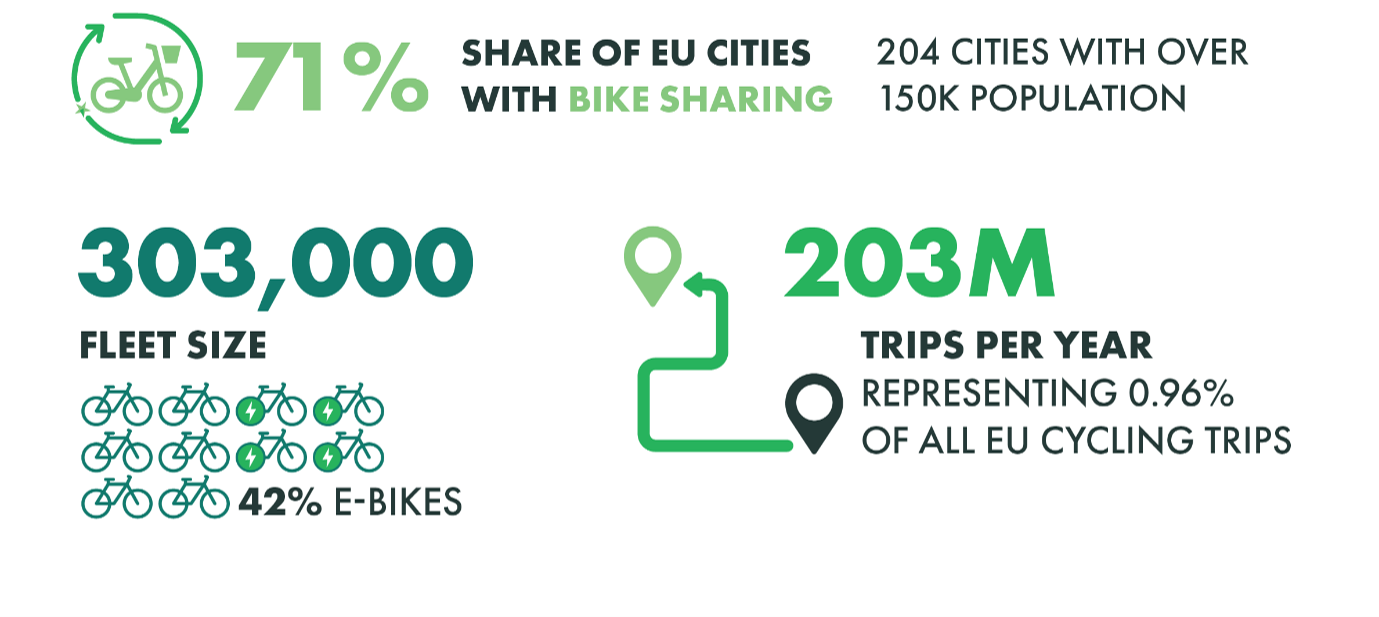
The most advanced sector in terms of standardised indicators and definitions, data collection methodologies and data sets available is bike sharing. Here, data collection focused on cities with over 150,000 inhabitants since they are most likely to be equipped with bike sharing systems. In the EU as a whole, 71% of these cities have a bike sharing system in place. These systems account for more than 300,000 shared bikes, of which 42% are electric, and more than 200 million trips per year, which is around 1% of all cycling trips in the EU. However, in some countries and especially in those with lower overall cycling rates, this share can go up to almost 5%, pointing towards the importance of bike sharing in establishing a cycling culture.
Conclusions and outlook
Thanks to Cycling Counts, we know for the first time what the extend of cycle networks in the EU is, how much Europeans cycle on average, how safe cycling is and how wide-spread services like bike sharing are.
These results were accomplished by a consortium consisting of ECF, European Cycling Industries, Rupprecht Consult, Transport & Mobility Leuven and Eurocities, and in close collaboration with the European Commission’s Directorate-General for Mobility and Transport, who commissioned the study. The consortium also consulted with a large variety of stakeholders throughout the whole project, including the network of Member States’ cycling contact points in national ministries. The preliminary results were already used by the Commission for the progress report on the implementation of the European Declaration on Cycling.
We noticed a strong correlation between the provision of dedicated infrastructure and services and the level of cycle use in EU Member States. Based on this correlation, the data collected in Cycling Counts enabled us to estimate for the first time future infrastructure and services needs in the EU. For example, we estimate that to double cycle traffic across the Union, 425,000 additional kilometres of dedicated networks (cycle tracks and cycle lanes) would be needed. For all cities over 150,000 inhabitants to reach the EU average on bike sharing, 111,000 more shared bikes would be needed, generating around 80 million additional trips.
We also developed detailed recommendations for future data collection, which will hopefully form the basis for progress monitoring on cycling in Europe for years to come.
Find all results and recommendations here.


